
Monitor Your IT Infrastructure 24/7, Detect Problems in Advance!
System monitoring and monitoring allow you to track the health of your IT infrastructure in real time and detect problems before users are affected. As Dem Teknoloji, we proactively manage your infrastructure with server, network, application, and database monitoring solutions. We perform comprehensive monitoring with industry-standard tools such as Zabbix, Prometheus, Grafana, ELK Stack, and offer real-time alerting and detailed reporting. We minimize downtime, optimize performance, and guarantee your business continuity.

Server Monitoring
We monitor your physical and virtual servers, operating systems in real time.
- CPU, RAM, Disk usage and I/O monitoring.
- Process-level monitoring and resource consumption analysis.
- Uptime and availability tracking.
- Windows, Linux, Unix server support.
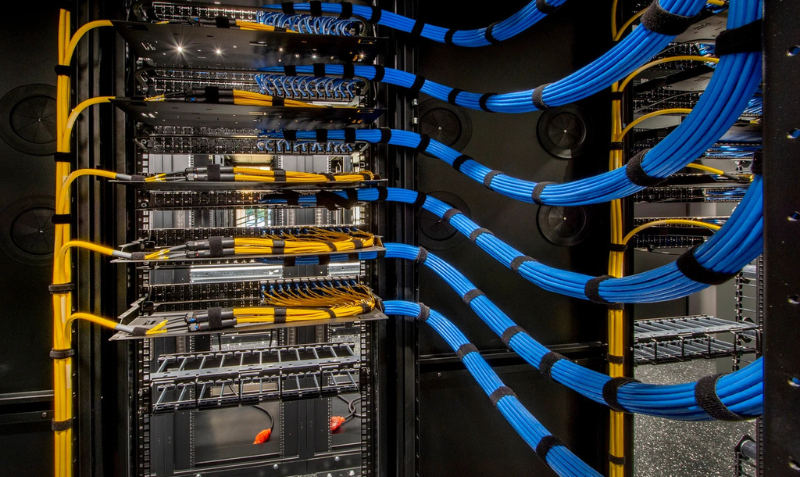
Network and Device Monitoring
We monitor your network infrastructure, switches, routers, and firewall devices.
- SNMP and ICMP based network monitoring.
- Bandwidth usage and traffic analysis.
- Port status and interface monitoring.
- Packet loss, latency and jitter measurement.

Log Management and Analysis
We centrally collect and analyze logs from systems.
- ELK Stack (Elasticsearch, Logstash, Kibana) setup.
- Centralized log collection and aggregation.
- Log parsing, search and filtering.
- Pattern detection and anomaly analysis.
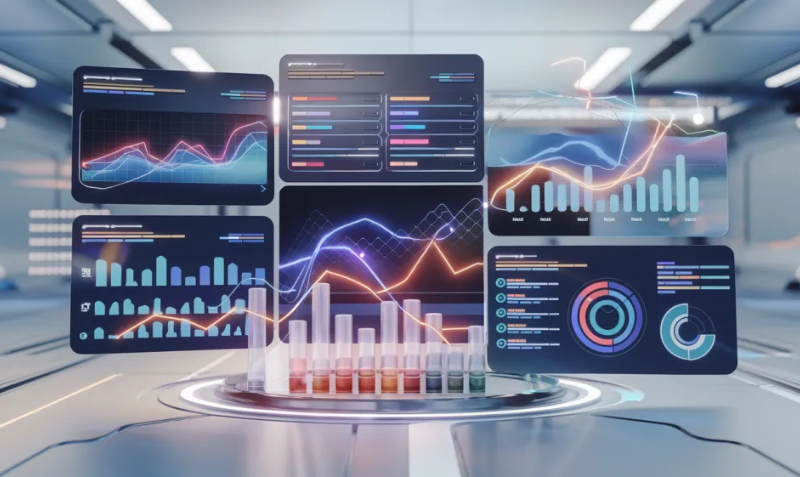
Dashboard and Reporting
We offer visual dashboards and regular reports with Grafana.
- Real-time dashboard and metric visualization.
- Custom dashboard design.
- Trend analysis and capacity planning reports.
- SLA reporting and uptime statistics.
Frequently Asked Questions
Monitoring allows you to track the health of your IT infrastructure in real-time. You detect problems before users notice them (proactive approach). You see performance bottlenecks and optimize. It minimizes downtime, ensures you meet your SLA targets. Provides data for root cause analysis. You perform trend analysis for capacity planning. You detect security events and anomalies. Creates an audit trail for compliance requirements. Allows you to do proactive IT management instead of reactive.
Infrastructure monitoring: Zabbix, Nagios, PRTG, Datadog. APM (Application Performance Monitoring): New Relic, AppDynamics, Dynatrace. Log management: ELK Stack (Elasticsearch, Logstash, Kibana), Splunk, Graylog. Metrics and time-series: Prometheus, Grafana, InfluxDB. Cloud-native: AWS CloudWatch, Azure Monitor, Google Cloud Monitoring. Network monitoring: SolarWinds, MRTG, LibreNMS. Synthetic monitoring: Pingdom, UptimeRobot. We choose and integrate the most suitable tools for your needs. We offer open-source and commercial solutions.
Threshold-based alerts: Alert when certain threshold values are exceeded (CPU > 80%, disk > 90%). Anomaly detection: Warning in deviations from baseline (machine learning based). Multi-condition alerts: When multiple conditions occur simultaneously. Alert channels: E-mail, SMS, Slack, PagerDuty, webhook integrations. Escalation policy: Forwarding to the next level if there is no response to the first alert. Alert grouping: Combining similar alerts. Maintenance windows: Silencing alerts during planned maintenance. We perform fine-tuning to avoid alert fatigue.
Real-time dashboards: Live metric visualization with Grafana. Executive dashboards: Summary views at executive level. Custom dashboards: Custom panel designs for needs. Mobile dashboards: Access from mobile devices. Historical trends: Historical data analysis and trend visualization. SLA reporting: Uptime and availability reports. Capacity planning reports: Resource usage and projection. Automated reports: Daily/weekly/monthly automatic reports. Export: Report output in PDF, CSV format. API access: API support for data integration.
Agent-based: A small software (agent) is installed on the target system. Collects detailed metrics (process-level monitoring). Resource overhead is minimal. Windows, Linux, Unix agents are available. Agentless: Collects data via protocols such as SNMP, WMI, SSH. Does not require agent installation. Ideal for network devices (switch, router). Provides less detail but easy to install. Hybrid approach: We can use both methods together. We recommend the most suitable method according to needs.
APM monitors application performance in depth. Transaction tracking: Tracks every user request. Distributed tracing: Tracks calls between microservices. Code-level visibility: Shows which function is slow. Database query monitoring: Measures SQL query performance. External service monitoring: Monitors 3rd party API calls. Error tracking: Captures exceptions and errors. User experience monitoring: Real user monitoring (RUM). Business metrics: Relates technical metrics to business KPIs.
Logs are records of system events and are critical for troubleshooting. Centralized logging: Collects logs from distributed systems centrally. Log aggregation: Combines logs from different sources. Log parsing: Parses unstructured logs. Search and filtering: Fast log search and filtering. Correlation: Links related logs together. Alerting on logs: Alarm on certain log patterns. Retention policy: Log retention period management. Compliance: Log archiving for audit requirements. ELK Stack is the most popular log management solution.
Synthetic monitoring checks with simulated user traffic. Uptime monitoring: Checks the accessibility of your website. Transaction monitoring: Tests critical user scenarios (login, checkout). Multi-location monitoring: Access tests from different geographies. API monitoring: Monitors REST/SOAP API endpoints. SSL certificate monitoring: Tracks certificate expiration date. Page load time: Measures page loading speed. Detects problems proactively (before real user sees). Pingdom, UptimeRobot are popular tools.
Retention period depends on needs and compliance. Real-time data: 1-7 days with high resolution. Short-term: 1-3 months with medium granularity. Long-term: 1-2 years downsampled (aggregated) data. Tiered storage: Old data is moved to cheap storage. Compliance requirements: Some sectors require 5-7 years retention. Cost optimization: Old data is archived or deleted. Prometheus retention: Usually 15 days. Grafana: Depends on datasource (Prometheus, InfluxDB etc.). Downsampling: Reducing old data to 5min->1hour average.
Cloud-native tools: AWS CloudWatch, Azure Monitor, Google Cloud Operations. Infrastructure monitoring: Monitoring EC2, VM, compute instances. Managed service monitoring: RDS, Lambda, AppService metrics. Cost monitoring: Spending tracking and budget alerts. Multi-cloud monitoring: Monitoring different clouds from one place. Hybrid monitoring: On-premise + cloud together. Cloud-agnostic tools: Platforms like Datadog, Dynatrace. Auto-discovery: Automatic discovery of new resources. Tagging strategy: Using tags for organized monitoring. Monitoring automation: Monitoring with Infrastructure as Code.
Golden signals (Google SRE): Latency, Traffic, Errors, Saturation. Infrastructure: CPU, Memory, Disk I/O, Network bandwidth. Availability: Uptime, response time, error rate. Database: Query performance, connections, replication lag. Application: Transaction rate, response time, error rate. Business metrics: Conversion rate, revenue, user activity. Network: Packet loss, latency, bandwidth utilization. Security: Failed login attempts, suspicious activities. Capacity: Disk space, connection pool usage. USE method: Utilization, Saturation, Errors. RED method: Rate, Errors, Duration.
Service scope: Monitoring infrastructure setup and management. Agent deployment and configuration. Dashboard and alert configuration. 24/7 NOC (Network Operations Center) monitoring. Alert response and incident escalation. Regular health check reports. Threshold tuning and optimization. Monitoring tool maintenance and update. On-call support and SLA guarantee. Monthly review and improvement suggestions. Integration support (ITSM, ticketing). Documentation and knowledge base. We lighten the load of your IT team with proactive monitoring.

Let Us Call You Now!
Fill out the form below, and we will call you immediately to answer your questions and offer you the most suitable solutions.